
TradFlakes
Home / Extensions / TradeMap
Extension

TradeMap

Multi-timeframe trend, structure and levels, read straight off your TradingView chart.
In private beta · not rated yet
View plans
Chrome
v1.0.0Updated 24 Sep 2026416 KBAnalysis
A read, end to end
Trend per timeframe, then bias, evidence, levels and triggers.
Why TradeMap

Every timeframe at once, off the chart you are already looking at.

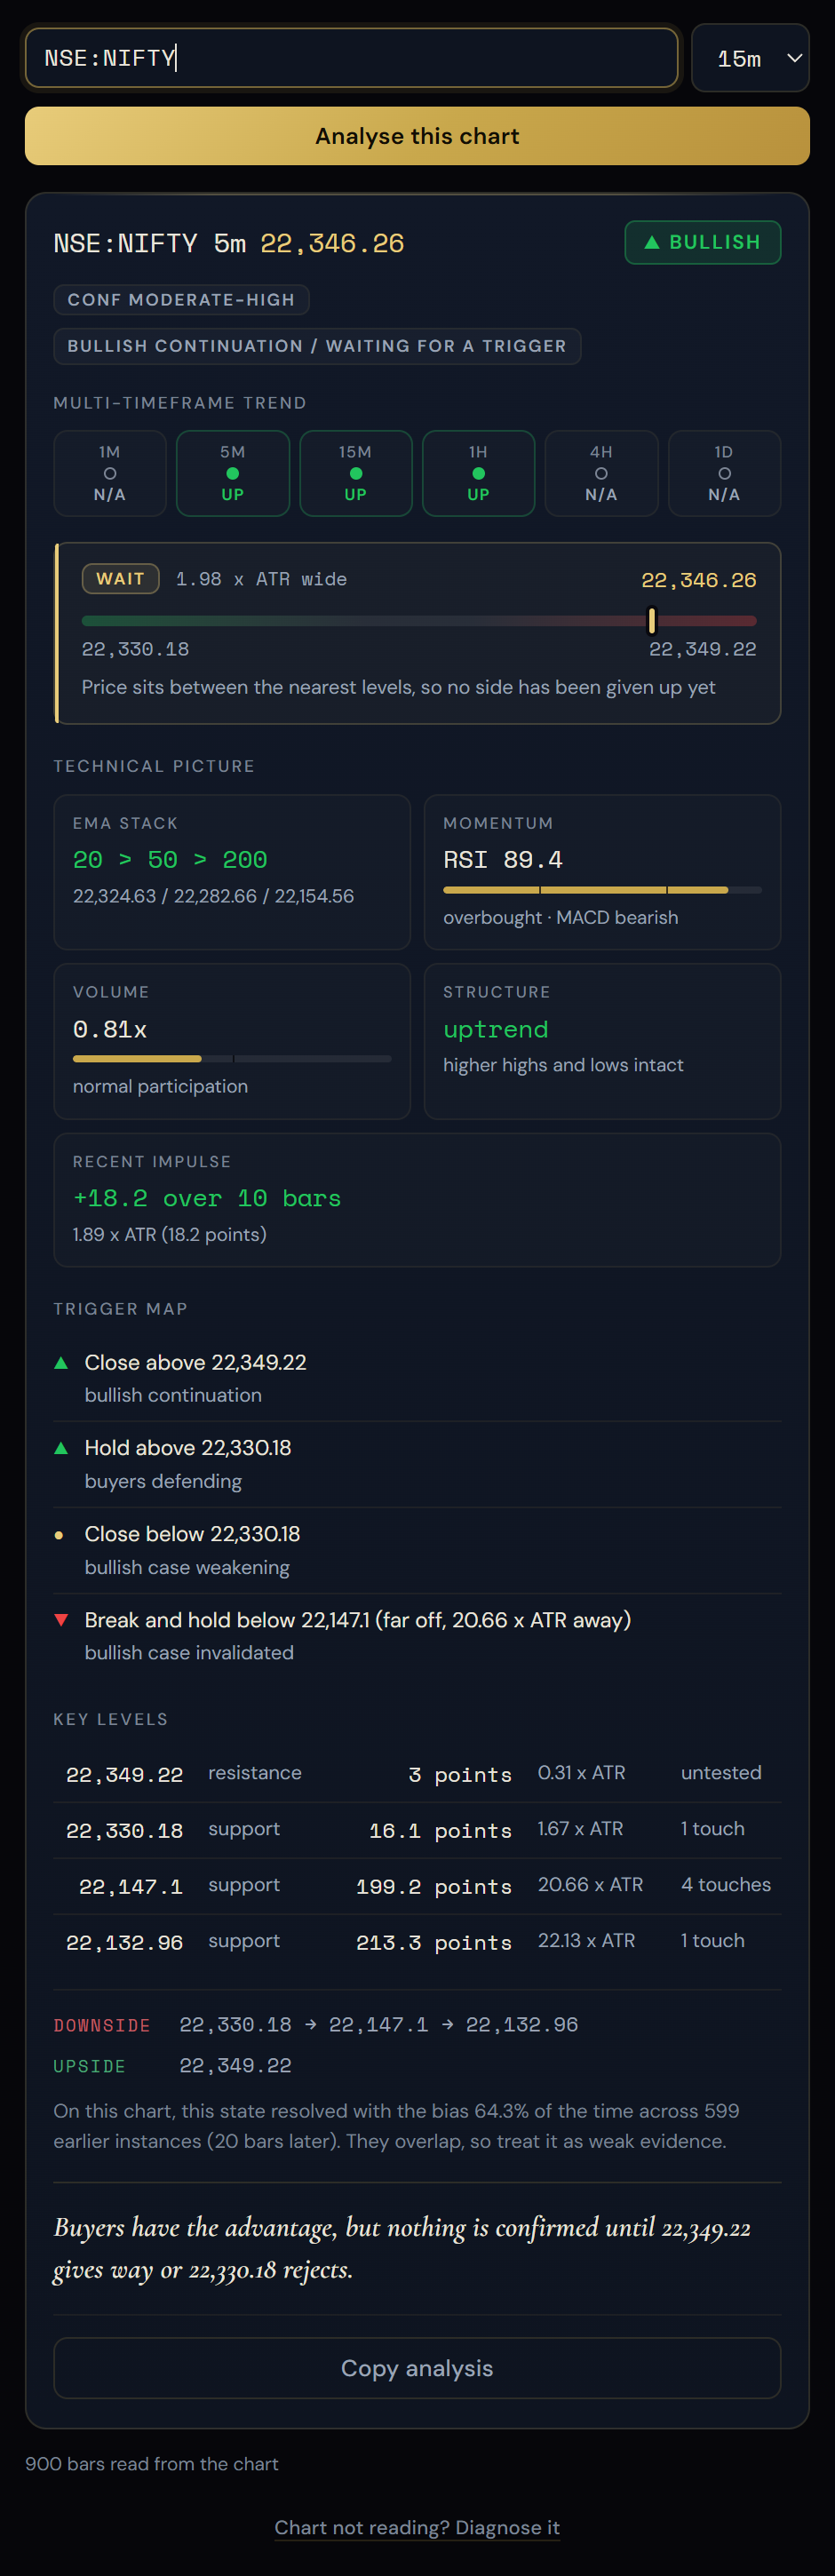
TradeMap reads the TradingView chart in front of you and states what it has done: which way each timeframe points, where price stands, the levels either side, and what would confirm or break the read. The analysis is arithmetic — no model, no machine learning, no price feeds. The engine runs inside the extension, so your chart never leaves the browser.

Trend on every timeframe
1m to 1d, each marked up, down or sideways, with the market structure behind it — higher highs and lower lows read from confirmed swing points. See alignment at a glance instead of flipping charts.
Levels that have been tested
Support and resistance from fractal pivots, clustered and ranked by how many times each has actually been touched, with the distance in pips and in ATR.
A decision card, with its reasoning
Bias, how strong the evidence is, and why: moving averages, RSI, MACD, recent impulse in ATR, volume. Hover the confidence to see every point that built it.
A trigger map
What would confirm the read, what would weaken it, and the zone where there is nothing to do yet.
It refuses rather than guesses
Timeframes that cannot be derived are reported missing, not invented. An interval it does not model is named and declined. Every reading is audited against the fact sheet before you see it.
Nothing leaves your browser
No network traffic at all. No accounts, no uploads, no server to send anything to. The engine is the extension.
How it works

Running in under a minute

01
Install
Add TradeMap from the Chrome Web Store. There is nothing to configure and nothing to start.
02
Pin it
Click the puzzle-piece icon in Chrome's toolbar and pin TradeMap. Chrome hides new extensions, and this is how you open it.
03
Open a chart
Go to any TradingView chart and click the TradeMap icon. Drag the panel by its title bar somewhere clear of the candles.
04
Analyse
Press "Analyse this chart". Every timeframe, the levels, and the reasoning — in one click.
Free vs Pro

The free tier is not a countdown

It keeps working for as long as you use it. Pro removes the limits below.

FeatureFreePro
Trend on every timeframe
Bias and confidence band
Market structure per timeframe
Key levels, touch counts, ATR distance—
Trigger map—
Full prose reading—
Fact sheet — every number behind the card —
Precedent figures—
Works offline, nothing uploaded
Plans

Pay for it once you trust it

Three days of full access, then keep the free tier or go Pro. One licence covers up to three browsers. Every plan is a single payment — nothing renews on its own, and we never store your card.

OfferSave up to 43% right nowThe lifetime plan is discounted below. Prices go back up when the offer ends.
Private beta
₹300Save 34%
₹199
planned launch price, per month
Not on sale yet
Works on any TradingView chart
No account, no sign-in, no data feed
Nothing leaves your browser — ever
FAQ

Before you install

No. There is no network traffic at all — no accounts, no uploads, no server. The engine runs inside the extension, so the chart never leaves your browser. You can verify this: the extension requests no host permissions and contains no network calls.
TradingView, on any chart. It reads the chart's own series data rather than scraping pixels, so it works with whatever symbol and timeframe you have open.
No. Data export is a paid TradingView feature, so TradeMap reads the chart's series object instead, which works on a free account. Paid accounts get the export route as a fallback.
Higher timeframes are built by aggregating the bars on screen, so a 15m chart gives you 15m and upward. Lower ones cannot be derived — a 15m candle keeps no record of the 1m candles inside it — so they are reported missing rather than invented. Open the 1m chart and the whole ladder fills in.
No. It describes; it does not advise. No entries, no stops, no targets, no predictions. It names the levels and the conditions that would confirm or break a read, and the test suite fails if the wording ever drifts into an instruction.
It says so, and why. A refusal you can act on is recoverable; a confident wrong answer is not.
What it can and cannot see
Read the TradingView tab you are on, only when you click the icon
Local storage, to remember your last symbol and timeframe
No analytics, no tracking — nothing leaves your browser
No credentials, no API keys, no order placement
Full detail in the privacy policy.
Recent releases
v1.0.024 Sep 2026
  • First public release
  • Multi-timeframe trend, structure, levels, decision card and trigger map
  • Engine runs entirely in the extension — no server, no network

Want it early?

Beta invites go out in batches. Join the list and you are in the next one.

Private beta